
Experience and progress from no Log to advanced Log
“25–60% of a developer’s time is spent on debugging”
If your code belongs to the lower end where is less bugs, still you will spend a big chunk of your time on it. This mean that to master debugging skills is mandatory for every developer and well spent time.
If you have joined some project that was long in progress, with lots of legacy code and bugs that exist long time, then this text is especially for you.
Introduction
Every developer comes to the point when there is a bug that needs to be resolved. When QA or user detects a bug, developers have tendency to ask for reproduction steps. MRE (Minimal, Reproducible Example) description is desired.
Even better if reproduction rate is 100%. Then to find the source of the issue is just matter of time.
But what if the bug is not reproducible on dev team end, but we still see that in production environment. From 1 000 000 user, for 0.1% this issue is happening. That are 1000 daily users maybe, not a small amount.
Logs to the Rescue
Logs are really good way to see user behaviour before bug. In my experience most of the projects have some kind of logging mechanism at least some kind of console log for development purpose: print, console.log, NSLog etc. Every technology have something. Every “if statement”, every button tap, network call or error should be covered with some kind of log. Of course every log should be meaningful, otherwise it is just spam or not relevant information.

A bit advanced approach is to have different kind of log levels like:
debug, error, info, warning, verbose.

This can be bigger list or a bit different, but the idea behind is similar. If you are coming from mobile world then CocoaLumberjack should be familiar framework. It helps a lot about formatting the log, but still it is “offline” log.


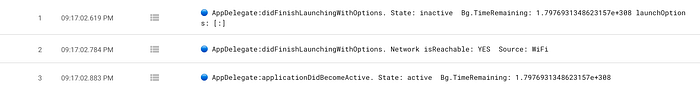
One tip what can help to make logs easier to read are emojis.
On next picture there is a pseudo log example.

Crashlytics
To be effective we would like to be able to group, query and to be able to analyse logs from production users. Now Firebase Crashlytics to the rescue.
In case you are not familiar with Firebase family like Analytics, Performance, Crashlytics i would highly recommend to learn it a bit deeper. I will do some quick introduction, but detailed Crashlytics integration and explanation is on this link. For now it is enough to know that Crashlytics is a framework that helps us in case of crash to see the Stack Trace.

There are also non-fatal error what are useful for cases when we want to know that event are happened but not critical. App will not crash. E.g.: when network call fails. In this case we know that something is wrong with particular API call but user will be still able to use the app.


There are also an option too append to the crash some customised keys, some are added by default by SDK.

Regardless if crash or non-fatal error is happening. Crashlytics have log option that makes a list of last 64kb of custom logs, that will be uploaded to dashboard. If there are more than 64kb of logs, then in FIFO way the oldest will be deleted.
If you are using Firebase Analytics and Firebase Crashlytics logs, all will pop-up on same dashboard with timestamps.
Sum Up
Regardless if project is new or legacy. If there is some logging system, even a simple print. It is easy to create a wrapper around it, and with just a couple lines of code to sent it to Crashlytics.
Even if at first look it can look messy, we already have bigger picture what is happening in the application and thats matter. After just need to expand the logs for new and old part of the system, delete the not relevant ones.
Occasionally analysing this logs helps us to have some early diagnostics and improvements. And even to prevent some bugs what can escalate to bigger ones by not noticing them on time.
If you came to this point clap, share if you like it. I would like to hear your experience also, so don’t hesitate to add comment.
If you got to this point, thanks for reading. 🙂 If you like the content please 👏, share, subscribe, buy a coffee it means to me. If you have some suggestions or questions please feel free to comment.
Tips
- Wrap old “print” system to do quick log on legacy project.
- Use emojis 👉 if you have difficulties to add colours to logs (like xcode terminal).
- Log every “else” fallback statement.
- Log every user initiated interactions 👆(tap, scroll beginning…).
- Log every API call result ✅ or ❌.
- Log async results. This can show if something is working by coincidence but can be source of bug.
- Log app lifecycle methods 🔵.
- Log when is app unlocked 🔓/locked 🔐.
- Log when local data base is loaded (like CoreData) 💾.
- Log when screen is loaded and shown, reloaded (Firebase Analytics can do part of this automatically with no effort).
- Log network connection change and source 🌎.
- Log background process lifecycle ⬇️.
- Care for user privacy. If there is some sensitive data, replace it with ⚠️REDACTED ⚠️.